New Hampshire 2023 Year in Review

NH year in review infographic
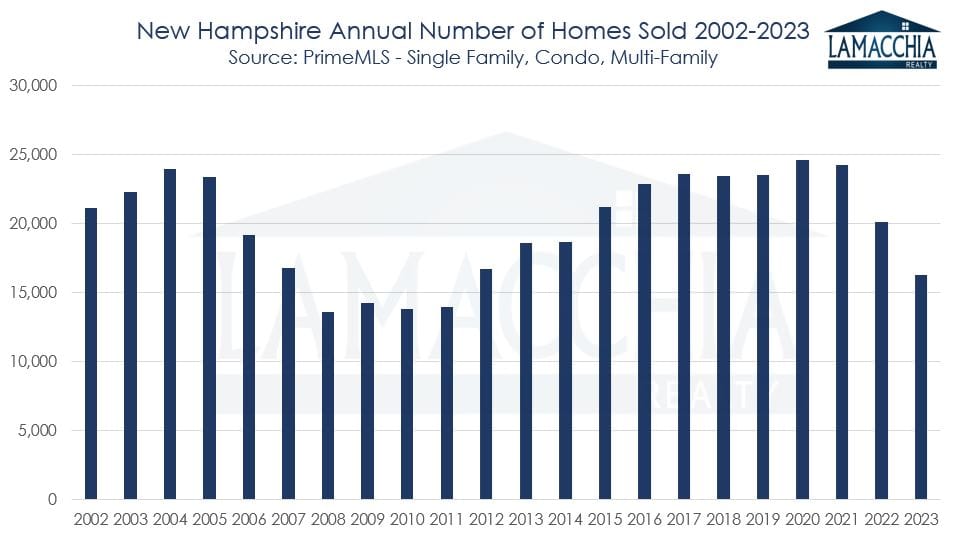
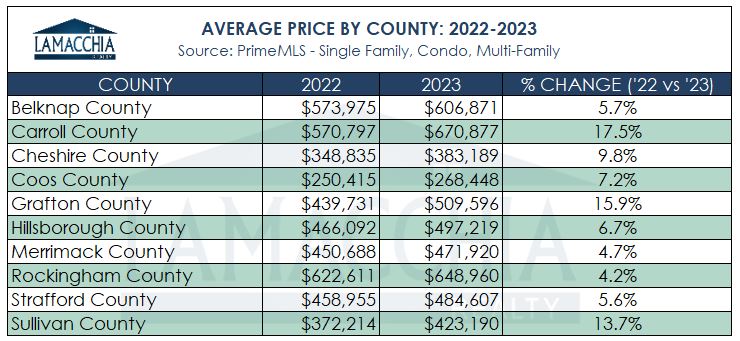
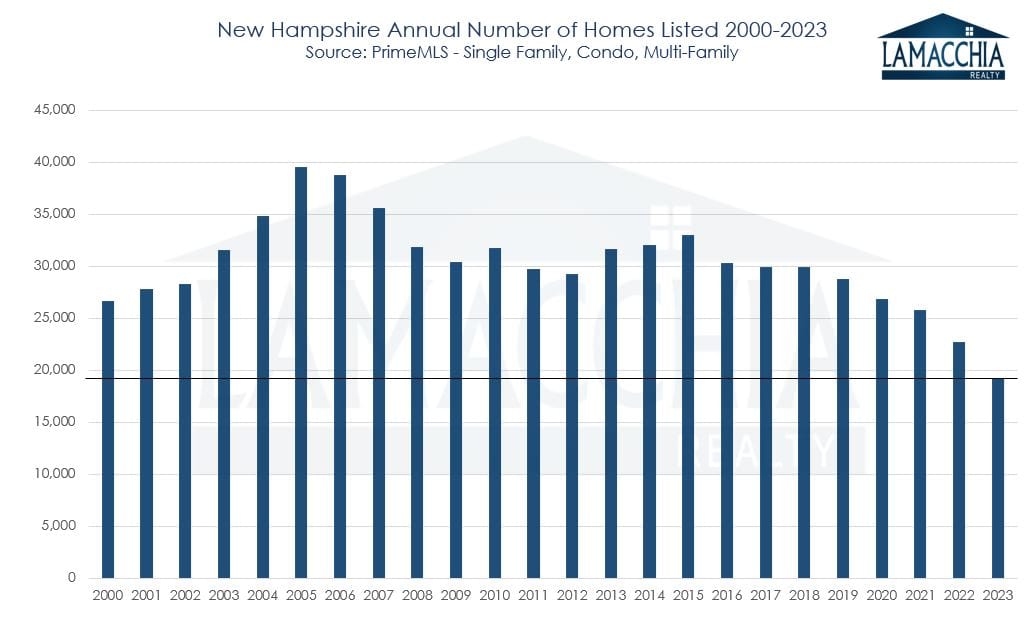
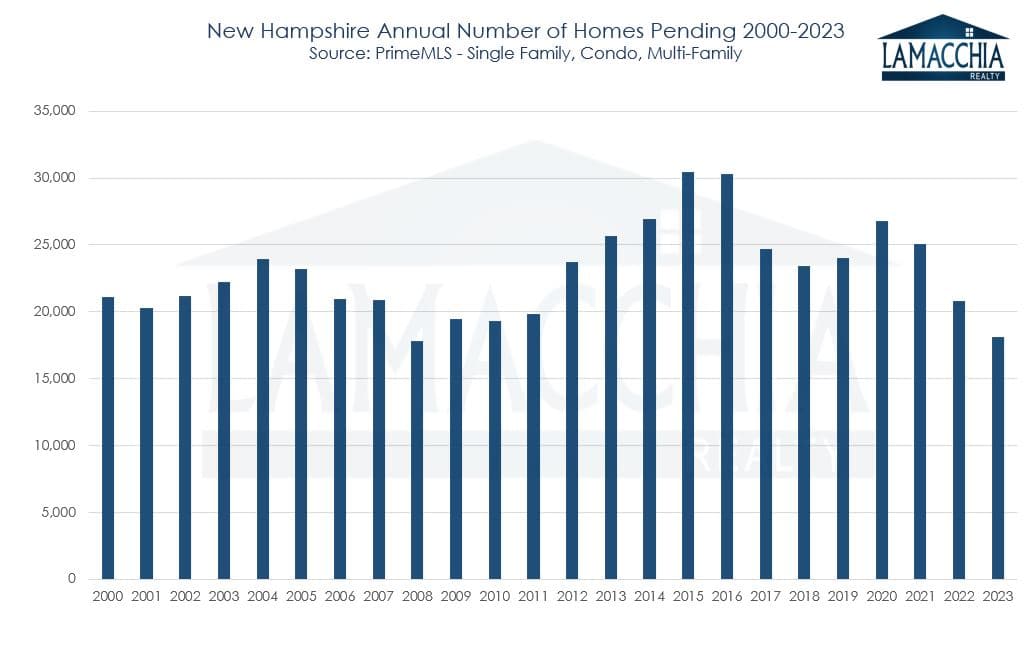
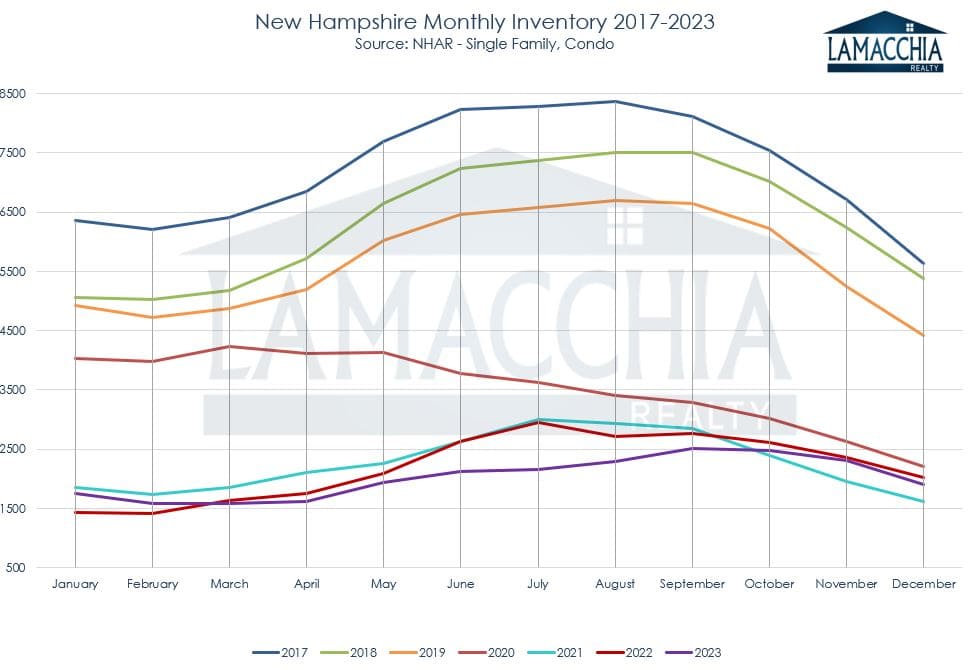
The real estate landscape witnessed significant developments in 2023, as the New Hampshire market saw a historic low in listings. This scarcity in inventory exerted upward pressure on prices, although it coincided with a 19% decline in sales. Despite this decline, motivated buyers were out there trying to secure a home while also trying to navigate lower affordability and low inventory. Sales were also down in 2022, which sparked concerns of a market crash, but as Anthony predicted, it didn’t happen, more thanks to reduced inventory rather than a decline in sales.

The 2022 slowdown was a welcome break from the unsustainable frenzy of 2021, and 2023 continued the trend towards balance, albeit with some challenges.

This report breaks down state-wide sales (previous years mostly covered Southern NH and the Lakes Region), average prices, the number of active listings, and how many listings went under contract for 2023 compared to 2022, and discusses what is predicted to unfold in 2024. 

2023 Real Estate Performance Highlights

  • The number of homes sold decreased by 18.9%
  • Average prices for closed sales increased by 7.2%
  • Lowest number homes listed in recorded history, decreased by 15.1%
  • The number of homes placed under contract (pending) decreased by 13%
  • Low inventory has essentially bolstered up prices by keeping demand high and competition higher
  • In conclusion… 2024 is predicted to improve slightly.

Sales Decline by 18.9%

Sales in New Hampshire declined by 18.9% in 2023 with 16,317 sales compared to 2022 with 20,124 closed sales. The drop in nearly 4,000 closings wasn’t just because buyers weren’t buying; they would, but many couldn’t because sellers weren’t selling.

Sales were down in all three categories:

  • Single family sales down by 19%: 11,625 in 2023 from 14,359 in 2022
  • Condo sales down by 15.7%: 3,839 in 2023 from 4,555 in 2022
  • Multi-family sales down by 29.5%: 853 in 2023 from 1,210 in 2022

Below is a bar graph that depicts home sales per year since 2002. You can see this is the second year in a row that sales have been down since the 2020 COVID market, but now in 2023, sales are the lowest they’ve been since 2011.

Monthly sales in 2023 were down every month compared to 2022 as depicted in the bar chart below.  If you look at previous years, every month of every year was down from the previous year since July of 2020.  But that can be explained by the anemic inventory scenario where buyers were consuming more homes than ever, and supply couldn’t keep up with demand.

Average Prices Increase by 7.2%

Prices in 2023 increased to $531,598, up nearly $36,000 year over from $495,918 in 2022. Even with affordability challenges, prices continue to climb due to the persistent scarcity of inventory. Motivated buyers, contending with multiple offers, are pushing sales prices higher to outbid competition.

Prices increased in single families and condos but decreased in multi-families:

  • Single family prices increased by 6.5%: $563,927 in 2023 from $529,343 in 2022
  • Condo prices increased by 14.1%: $444,514 in 2023 from $389,489 in 2022
  • Multi-family prices decreased by 3.4%: $482,940 in 2023 from $499,904 in 2022

The bar chart below illustrates that in 2023, average prices reached their peak since 2008, marking an all-time high. While the year-over-year increase wasn’t as dramatic as the surges in 2021 and 2022, which indicates a relative calming, prices are still on the rise. This reaffirms we aren’t likely to see the market crash.

Monthly average prices, shown in the bar chart below, have been up year-over-year since February of 2020, the month before the COVID breakout. The purple bars for 2023 compared to the green, representing 2019 pre-COVID, is a dramatic increase.  It’s clear, however, that the year-over-year increases in 2023 were much calmer than the past two years indicating a leveling off in the spike.

In the graph below, county average prices increased across the board. The year-over-year increases spanned from 4.2% to 17.5%, with the highest increase in Carrol County, and the smallest year-over-year change in Rockingham County; Interestingly, those are two of the higher priced counties.

2023 Sees the Lowest Number of Homes Listed in Twenty-Three Years

Listings in 2023 experienced a substantial 15.1% decline compared to 2022, with 19,290 homes listed as opposed to 22,708 the previous year. Sellers find themselves in a holding pattern, desiring to move but hesitant due to the reluctance to part with their low pandemic-era interest rates. Consequently, we’re witnessing the lowest number of new listings since 2000.

Contrary to the misconception that interest rates only impact buyers, 2023 exemplifies their influence on sellers. The hesitation to lose rates in the 3% range, coupled with concerns about higher monthly payments upon buying again, has resulted in a scarcity of new listings. This shortage significantly contributes to the low inventory, keeping buyers in fierce competition and preventing a decline in prices.

The chart below illustrates the contrast with the period from 2004 to 2006, where a surge in home listings, coupled with low demand, led to the housing crisis—a scenario opposite to the current market climate.

Pending Sales Decreased by 13%

With the exception of 2008, 2023 concluded with the fewest pending sales since 2000. The decline, with 18,083 homes placed under contract, marked a 13% drop from 2022’s 20,780 pending sales. The driving factor behind this decrease is not lower demand but rather lower supply. You can’t purchase what simply isn’t available.

New Hampshire Housing Inventory is Still Quite Low

Listings, pending, and closed sales are all on a downward trend. If there is a surge in listings while pending and closed sales continue to decrease, inventory will rise, exerting downward pressure on prices. Unless this shift occurs, prices are likely to remain stable, with demand overwhelming supply.

In the line graph below, the purple line represents 2023, consistently trending lower than both 2022 and 2021. The end of 2021 and the start of 2022 marked the lowest inventory levels in at least seven years. The subsequent increase in inventory was prompted by a rise in mortgage rates, which, coupled with inflation, constrained buyer spending. However, we are still far from pre-pandemic inventory levels because sellers are hesitant to list their homes for sale, driven by a desire to retain pandemic-era rates.

Will the 2024 Real Estate Market Improve?

The paradoxical impact of mortgage rates having both negative and positive effects on both buyers and sellers has made the 2023 market a bit frustrating to say the least. Both buyers and sellers were held back from making moves; sellers, because they didn’t want to lose their low rates, and buyers because affordability was diminished. The slowed buyer activity was technically a good thing for inventory, but because sellers weren’t listing, supply didn’t really increase enough for the motivated buyers that were still out there. Due to the still-competitive buyer market, prices still rose, which was good for sellers, but not good for buyers contending with the high rates. A lot to digest.

In 2021, the theme was buyer demand; 2022 the theme was rapid mortgage rate increases; and 2023’s theme centered on a lack of inventory and decreased affordability. Only highly motivated buyers and sellers, driven by life changes like divorce or relocations, closed sales in the 2023 market.

Looking ahead to 2024, the theme is expected to be an ease in pressure. Anthony’s 2024 Predictions suggest that while the market will remain slow, sales may increase if rates trend downward and stay low. This could motivate sellers to list, causing inventory to rise and potentially slow the rise in prices.

Buyers can benefit from lower rates in 2024, with mortgage programs like buydowns and mortgage assumptions offering additional advantages. Sellers, taking advantage of lower inventory and high demand, can maximize their sales. Rates are potentially going to find their equilibrium in the 5% or 6% range which is historically moderate.